

This web site aims to depict long-term trends in digital amateur radio use, including both effects of ionospheric propagation and human behavior. Each plot shows a measurement of digital radio activity by amateur radio operators: the number of spots recorded per time period, the average distance between sender and receiver for those spots, etc. These are shown "per day" or, more commonly, "per 5-minute interval".
FT8 spots were collected by pskreporter.
Data source: pskreporter.info, via mqtt.pskreporter.info (http://mqtt.pskreporter.info/)
Huge thanks to my elmer, Bob Bownes KI2L.
Data analysis and graphs by Jeff Victor, KD2PWN.
| Current State | Primer | Events |
Long-term Day-at-a-Time Plots, showing the number of spots per day:
160m: 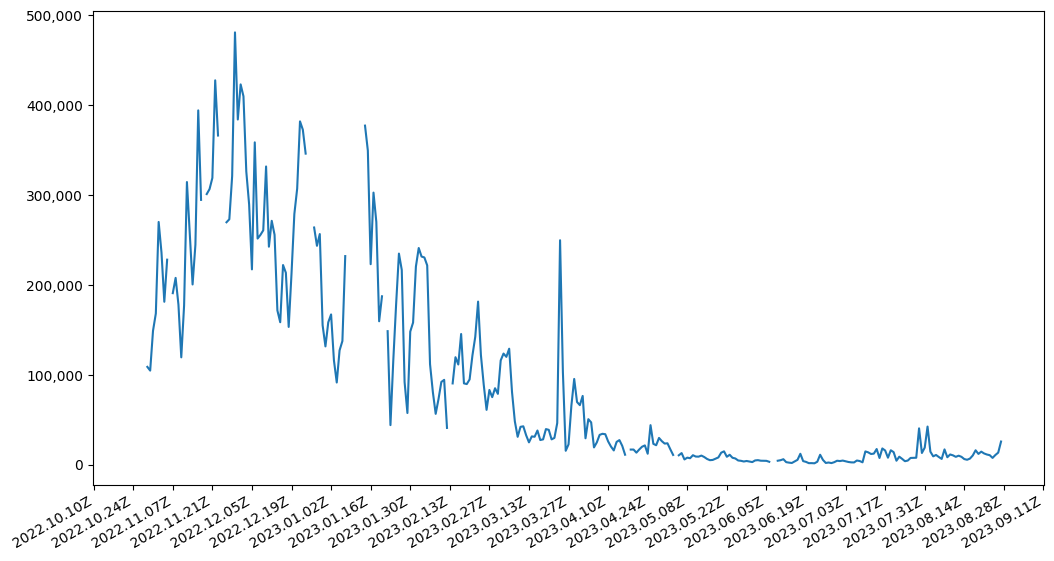 30m:
30m: 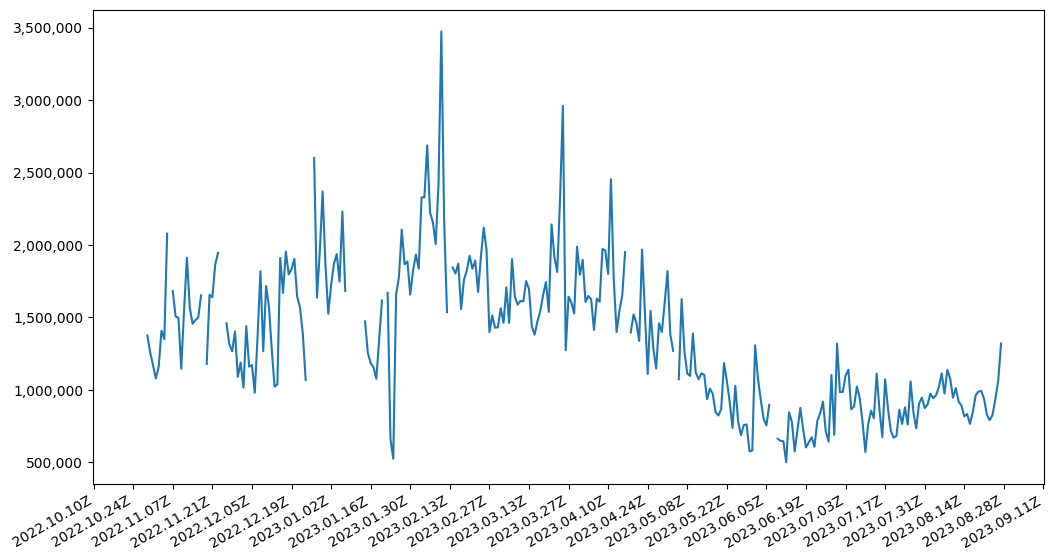 20m:
20m: 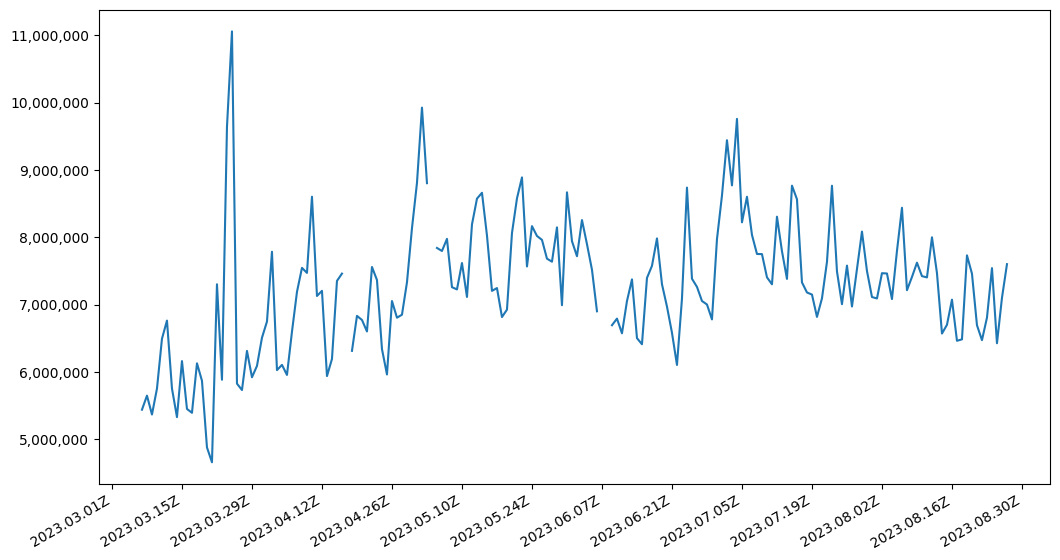 10m:
10m: 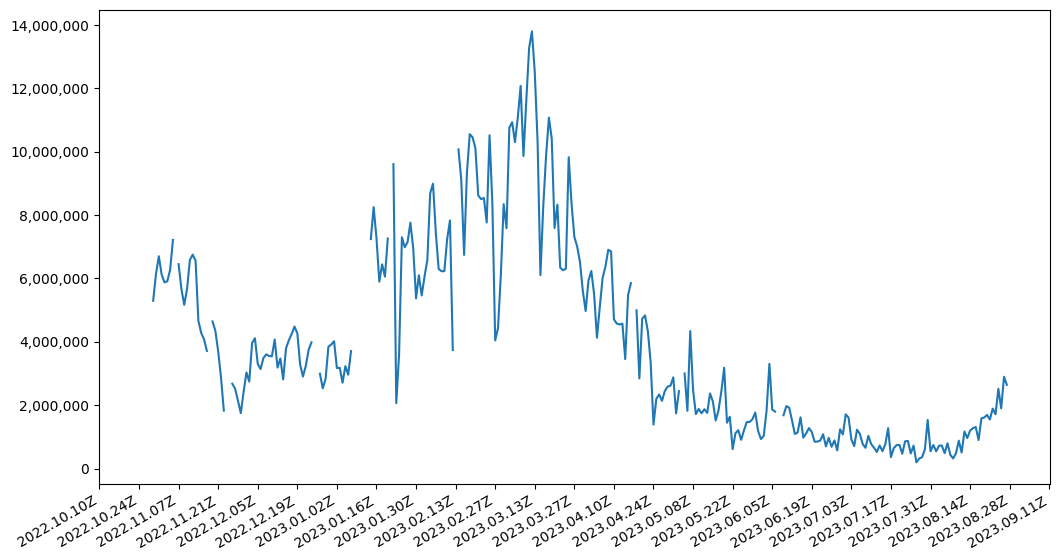
6m: 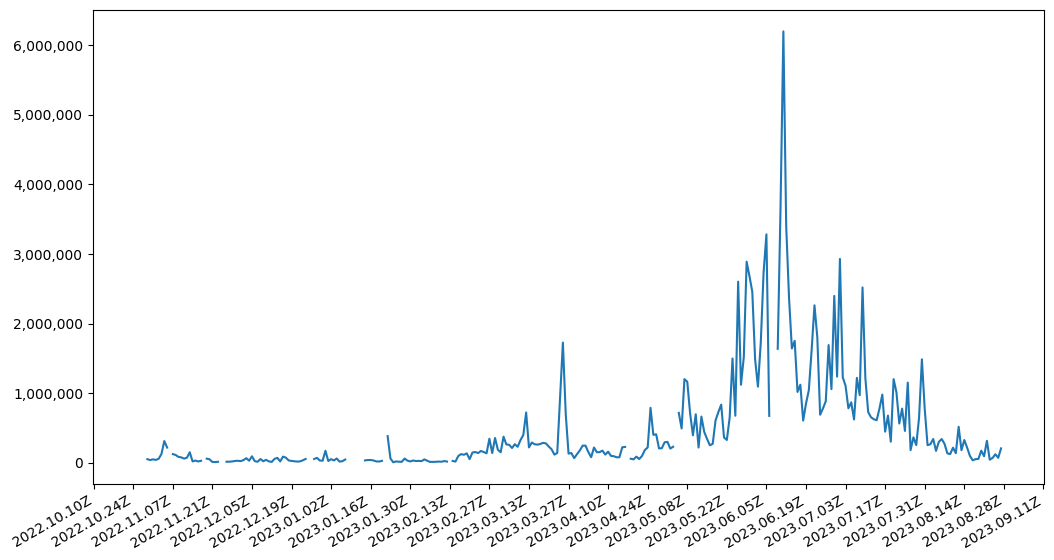 2m:
2m: 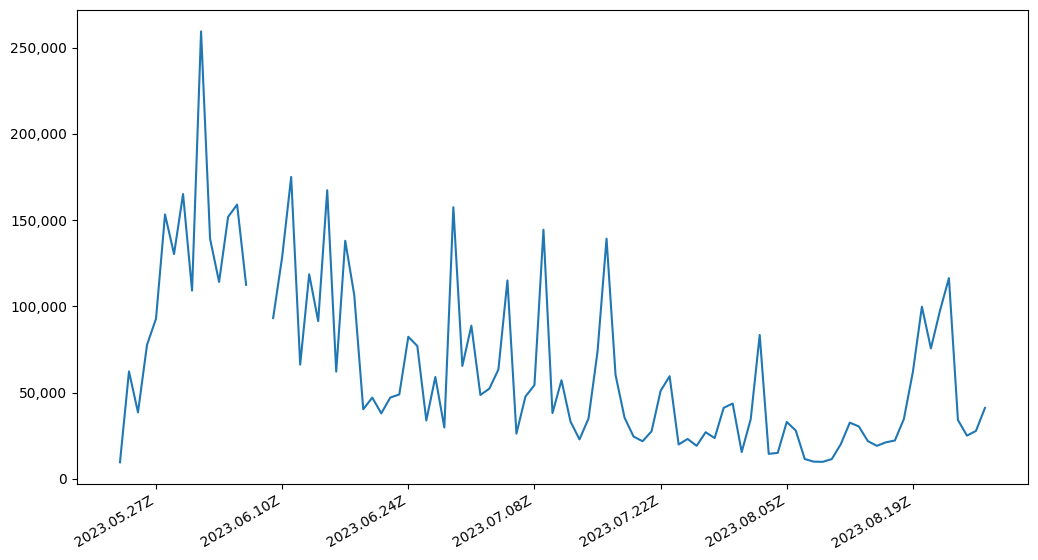
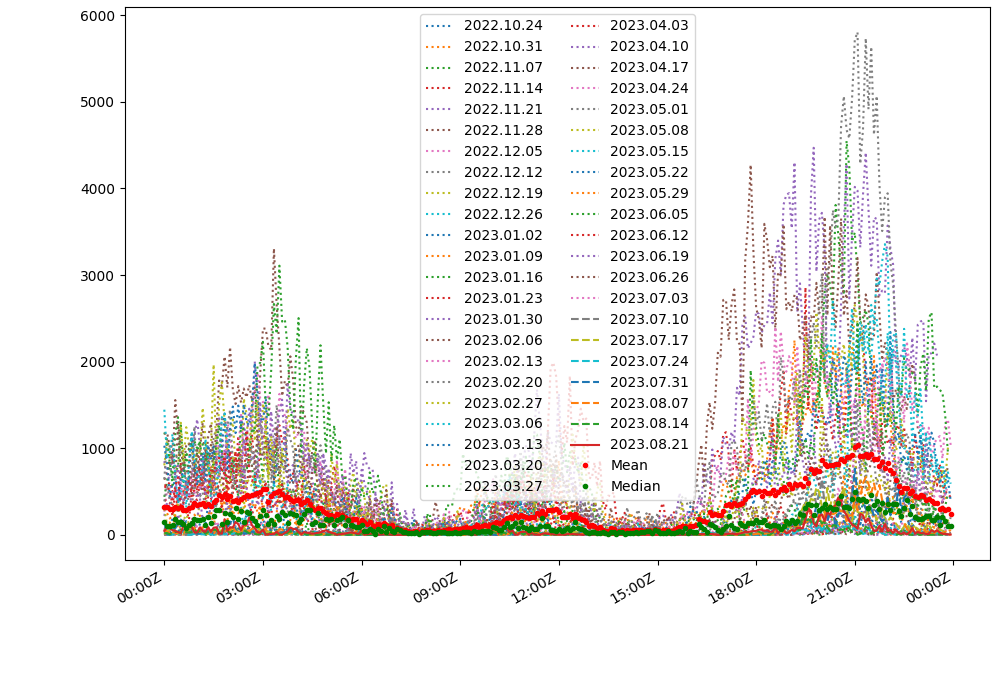
Long-term Day-of-the-Week Plots, showing the number of spots per day, grouped by day-of-the-week, e.g.:
|
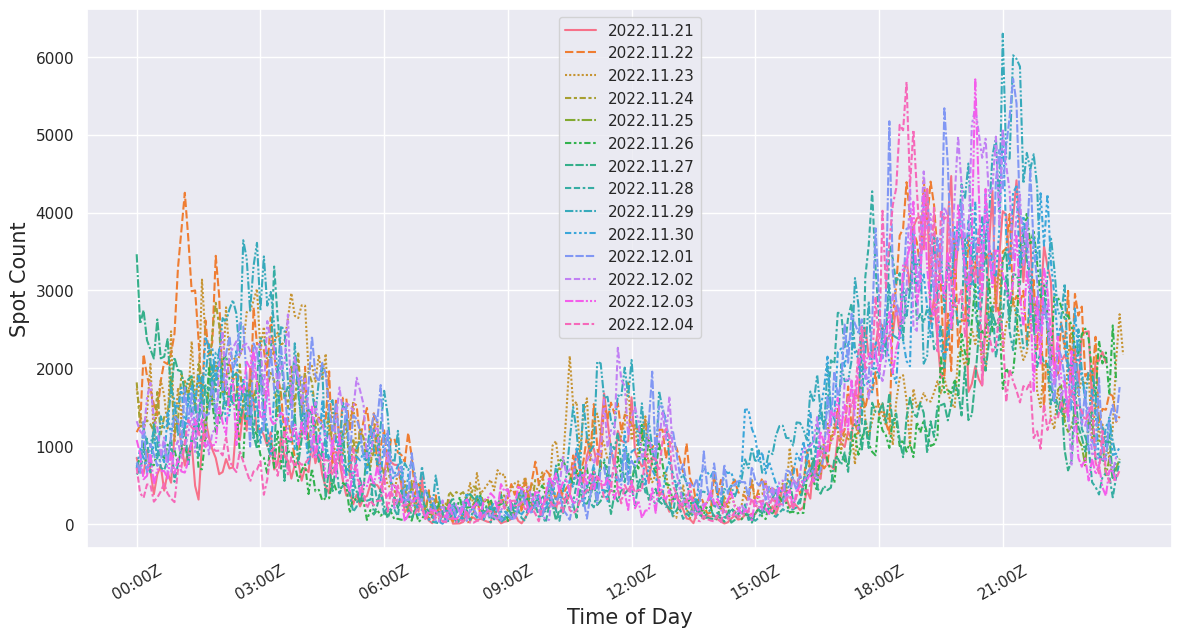
Sequential Multi-Day Plots showing the number of spots per 5‑minute interval, e.g.:
 |
Daily Plots, by band, showing the number of spots per 5‑minute interval, e.g.:
 |
Band Daily Plots
160m Daily Plots
30m Daily Plots
20m Daily Plots
10m Daily Plots
6m Daily Plots
2m Daily Plots
Test Auto-Detection of Openings with Basic Statistical Measures
Test
Grid Square Relationships
(Future)
Opening Detection
(Future)
Miscellaneous
- Replace standard deviation with coefficient of variation
- Use distribution density for sequential multi-day plots?
- Replace user interface (with JavaScript? REST API?)