The Sun Goes Pew Pew!
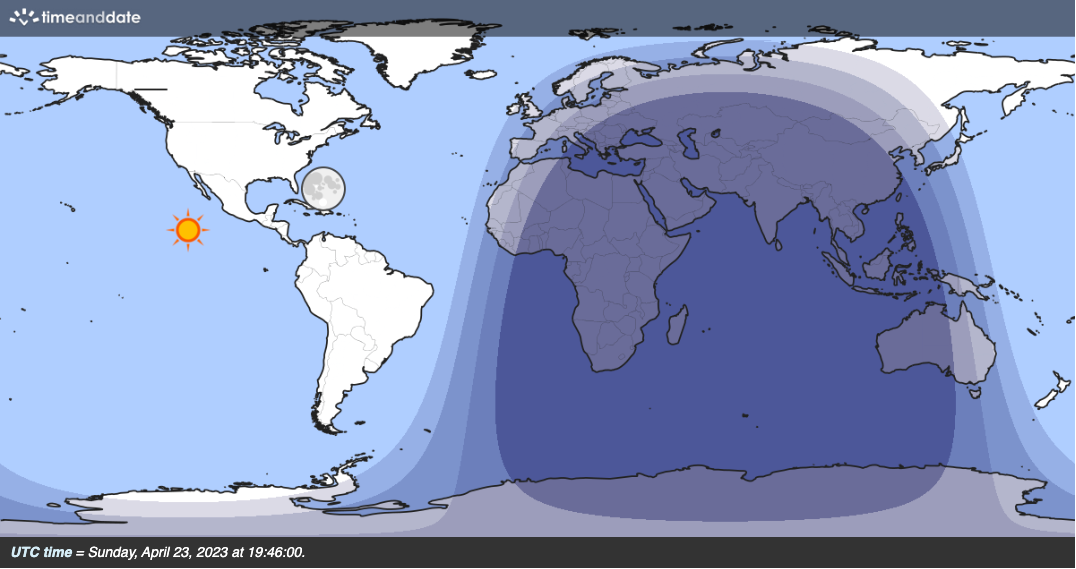
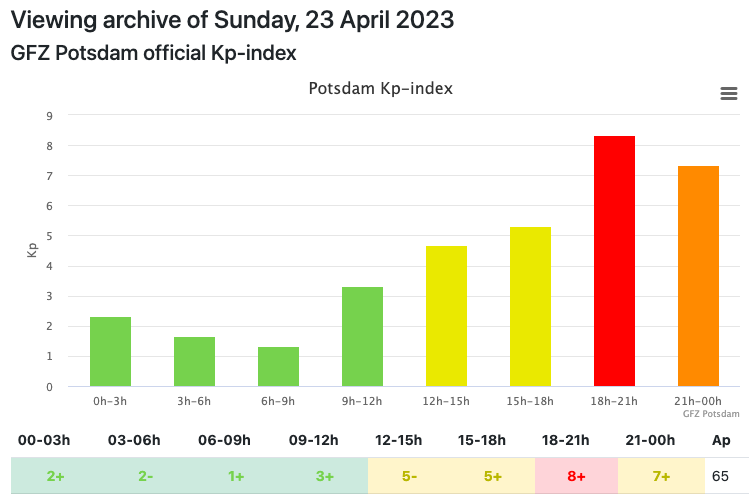
On 23 April 2023, a CME generated a severe (R4) geomagnetic storm at 19:26 UTC. The subsolar point was southwest of Mexico, at 12°39'N, 117°55'W.

Solar X-ray flux

The first set of plots shows actiivty on different bands, but spots are counted globally.
The global view of 6m activity shows little effect from the CME, though there is an unusual increase, two hours later.

10m activity was already depressed before the CME arrived, and decreased further after arrival. It's not clear whether the CME affected 10m.

20m activity decreased from "above normal" to "below normal" at the time of CME arrival.

Like 10m, 30m was already below normal before the CME arrived. The CME did not appear to have any effect.

The 6m video suggests east-Asian TEP until about 08:00 UTC.
We can "zoom in" on activity during the day, in specific Maidenhead fields.
Field PM
The 6m spot count from field PM shows there is never any activity here on 6m during that part of the day, so we can't learn anything from that.

The average distance plot shows the large portions of >1000km spots early in the day, likely TEP.

The 10m spot count for PM shows almost no actvity from 20:30 to 24:00 UTC, when usually there is some. The CME may have caused this.


In the 20m spot count for PM, reception begins to trail off 2 hours before the CME arrives. This lasted for the next few hours.


30m activity did not pick up like it usually does, right when the CME arrived. The effect is smaller than 10m or 20m.


Conclusion from PM data: the CME significantly depressed propagation on 10m and 20m when it arrived, and may have co-contributed to inferior propagation. The effect on 30m was less pronounced.
Field JN
The 6m spot count from field JN shows an unusually high level of activity from 07:00 to 13:00 UTC. It also shows that JN sees very little activity on this band after about 19:00 UTC, so we can't draw any conclusions about the CME.


On 10m, activity is low hours before CME arrival, so we can't draw a strong connection.


The effect of the CME can be seen in the 20m spot count plot. Activity began decreasing at 19:15, and was below the normal range by 19:40. It continued to decrease until 24:00.

The average distance dropped sharply when the CME arrived, but then recovered.

It's not clear that the CME affected the spot count on 30m, but there was a noticeable dip in the average distance in the 30 minutes before the CME arrived, though that recovered as 20m did.


It appears that the CME did not affect 160m in central Europe.


Field JO
6m at JO was very similar to JN.


10m at JO was very similar to JN.


Activity began decreasing on 20m at 18:30, but was not abnormally low until 19:30 when the CME arrived. The CME's affect was clear for the rest of the day.
The same was true of the average distances. Instead of the normal 6,000 km distance, the averge wandered around 1,500 km.


The behavior on 30m was similar to 20m, but muted.


As in JN, no affect on 160m was seen in JO.


Field IO


The CME depressed DX activity on 20m in IO.


Field GF


Field GG


Field FN


The number of spots was already low at CME arrival, but the average distance decreased significantly when it arrived, for about 30 minutes.


On 20m the average distance began a slow decline at 19:00, and stayed abnormally low for the rest of the day.


Field EM
There usually isn't much activity on 6m in EM at that time of day, so the CME didn't have much to depress. However, the spot count was extremely from 2 hours *after* CME arrival for the next 2 hours. Also, immediately after arrival DX activity picked up quite a bit.


Nothing unusual happened on 10m.


The activity level on 20m was high around that time, but the CME may have impaired DX.


Field DM
Activity on 6m in DM was similar to EM.


Field EL


Field FE


Field FK


Conclusion:
Explanation:


